Welcome to
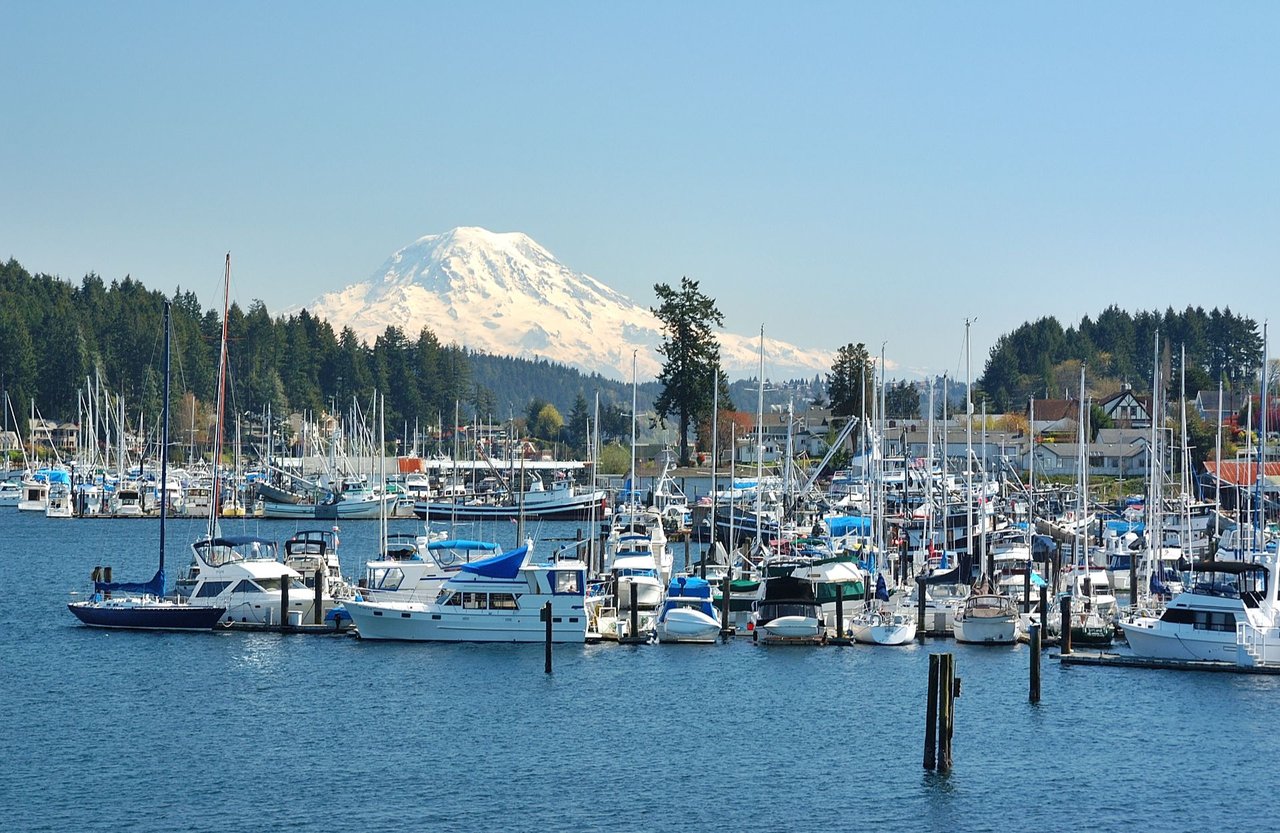
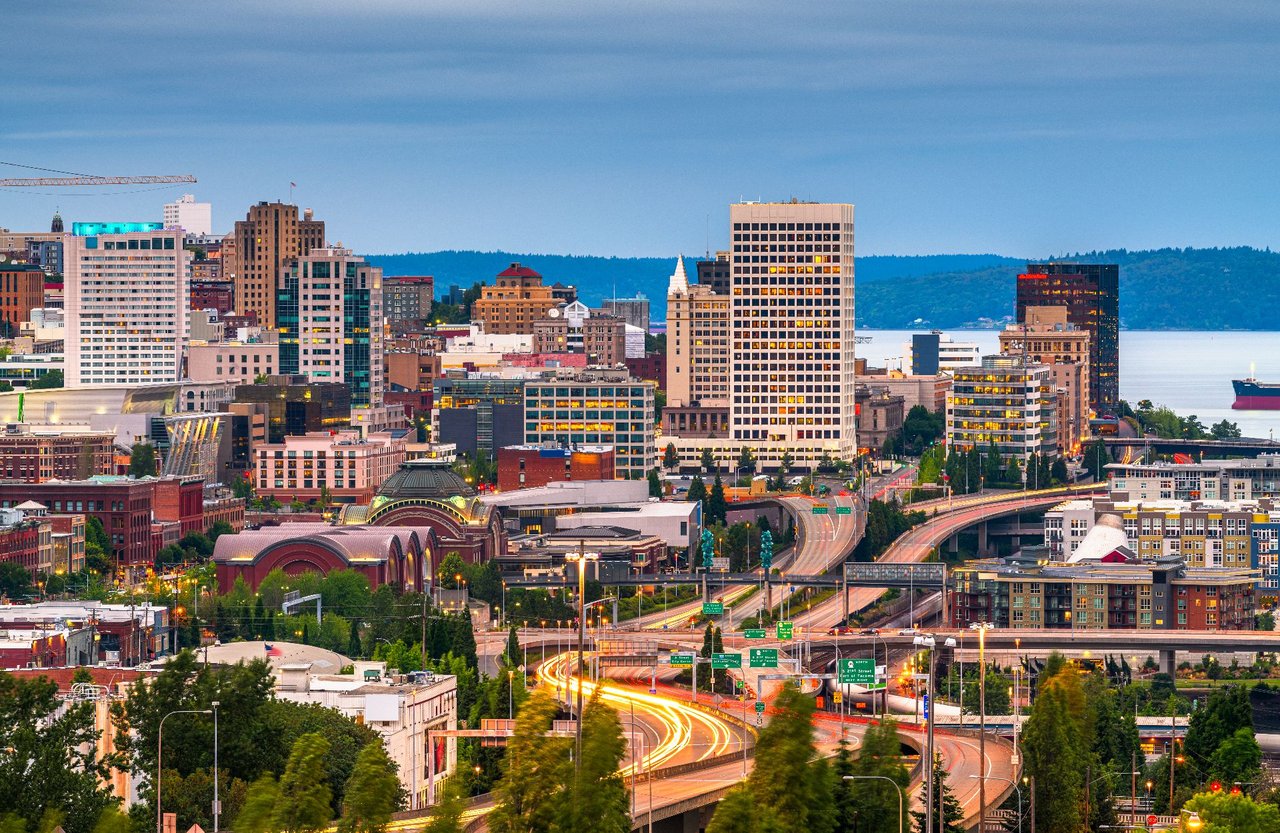
Downtown
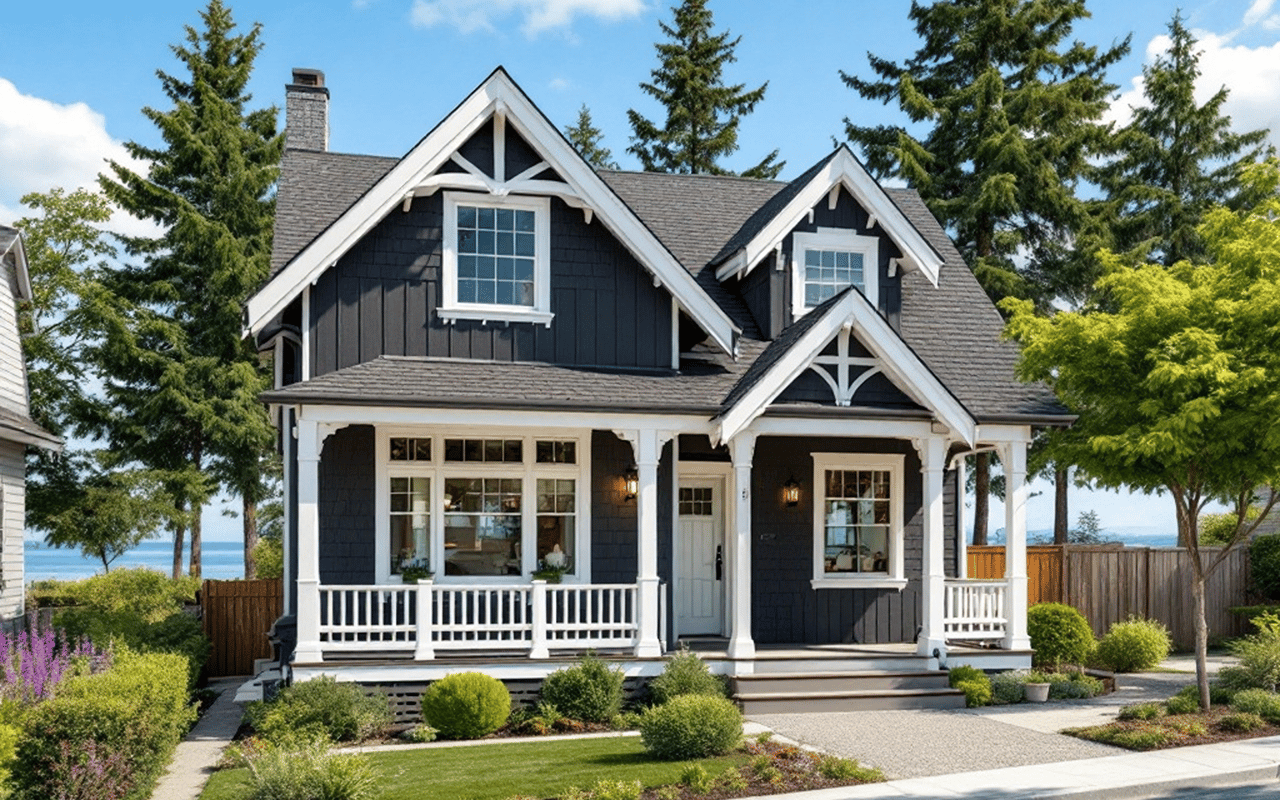
It is a practical way to live on the water without compromising on style.
2200 Bethel Avenue, Port Orchard, WA 98366
Provided by NWMLS, G Anderson Group LLC
Provided by NWMLS, G Anderson Group LLC
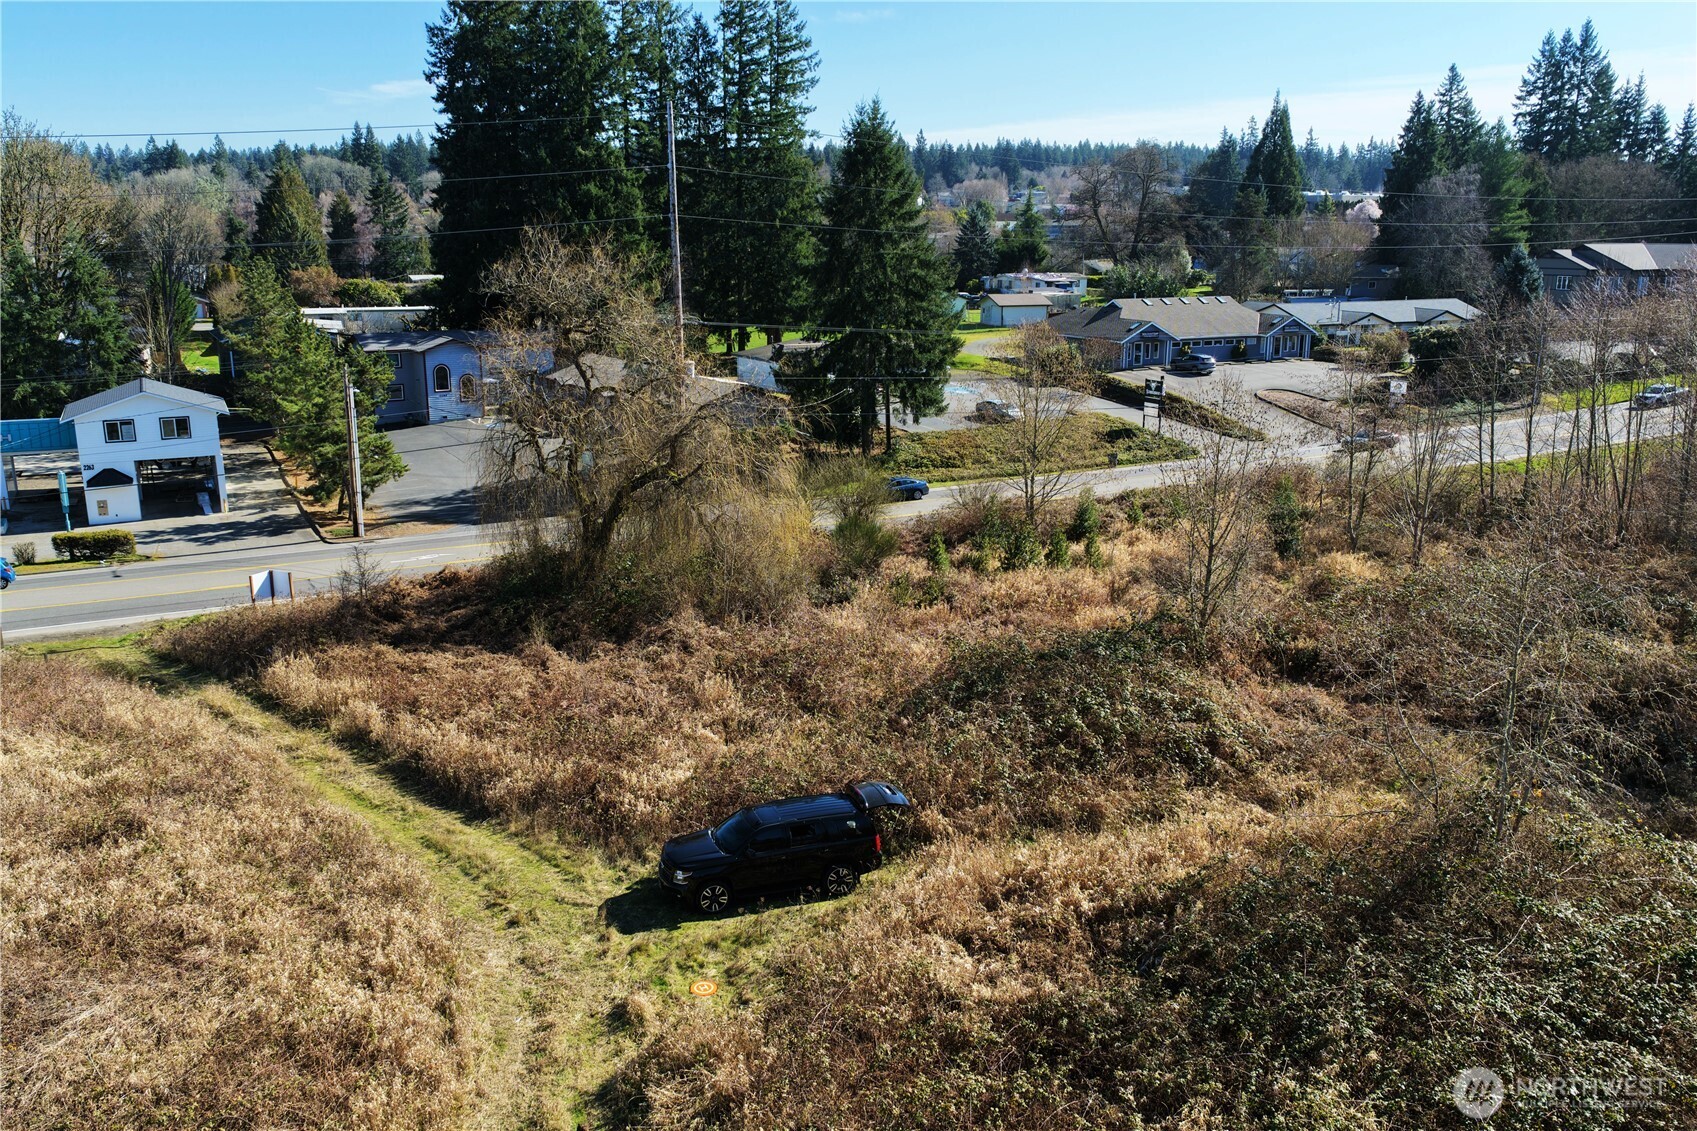
4494 SE Mile Hill Drive, Port Orchard, WA 98366
Provided by NWMLS, G Anderson Group LLC
Provided by NWMLS, G Anderson Group LLC
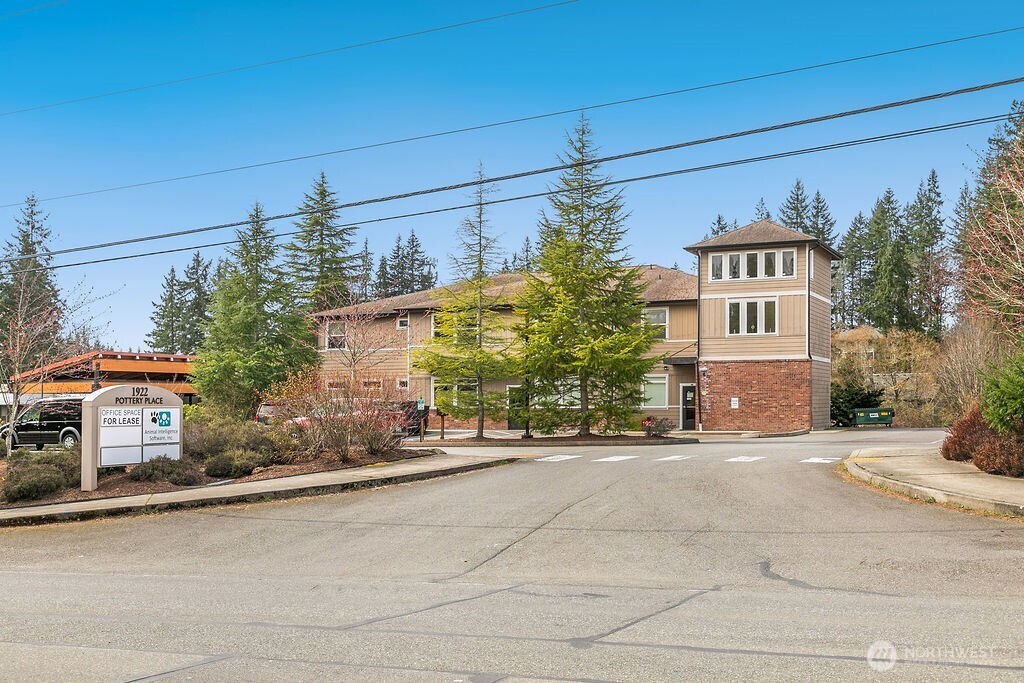
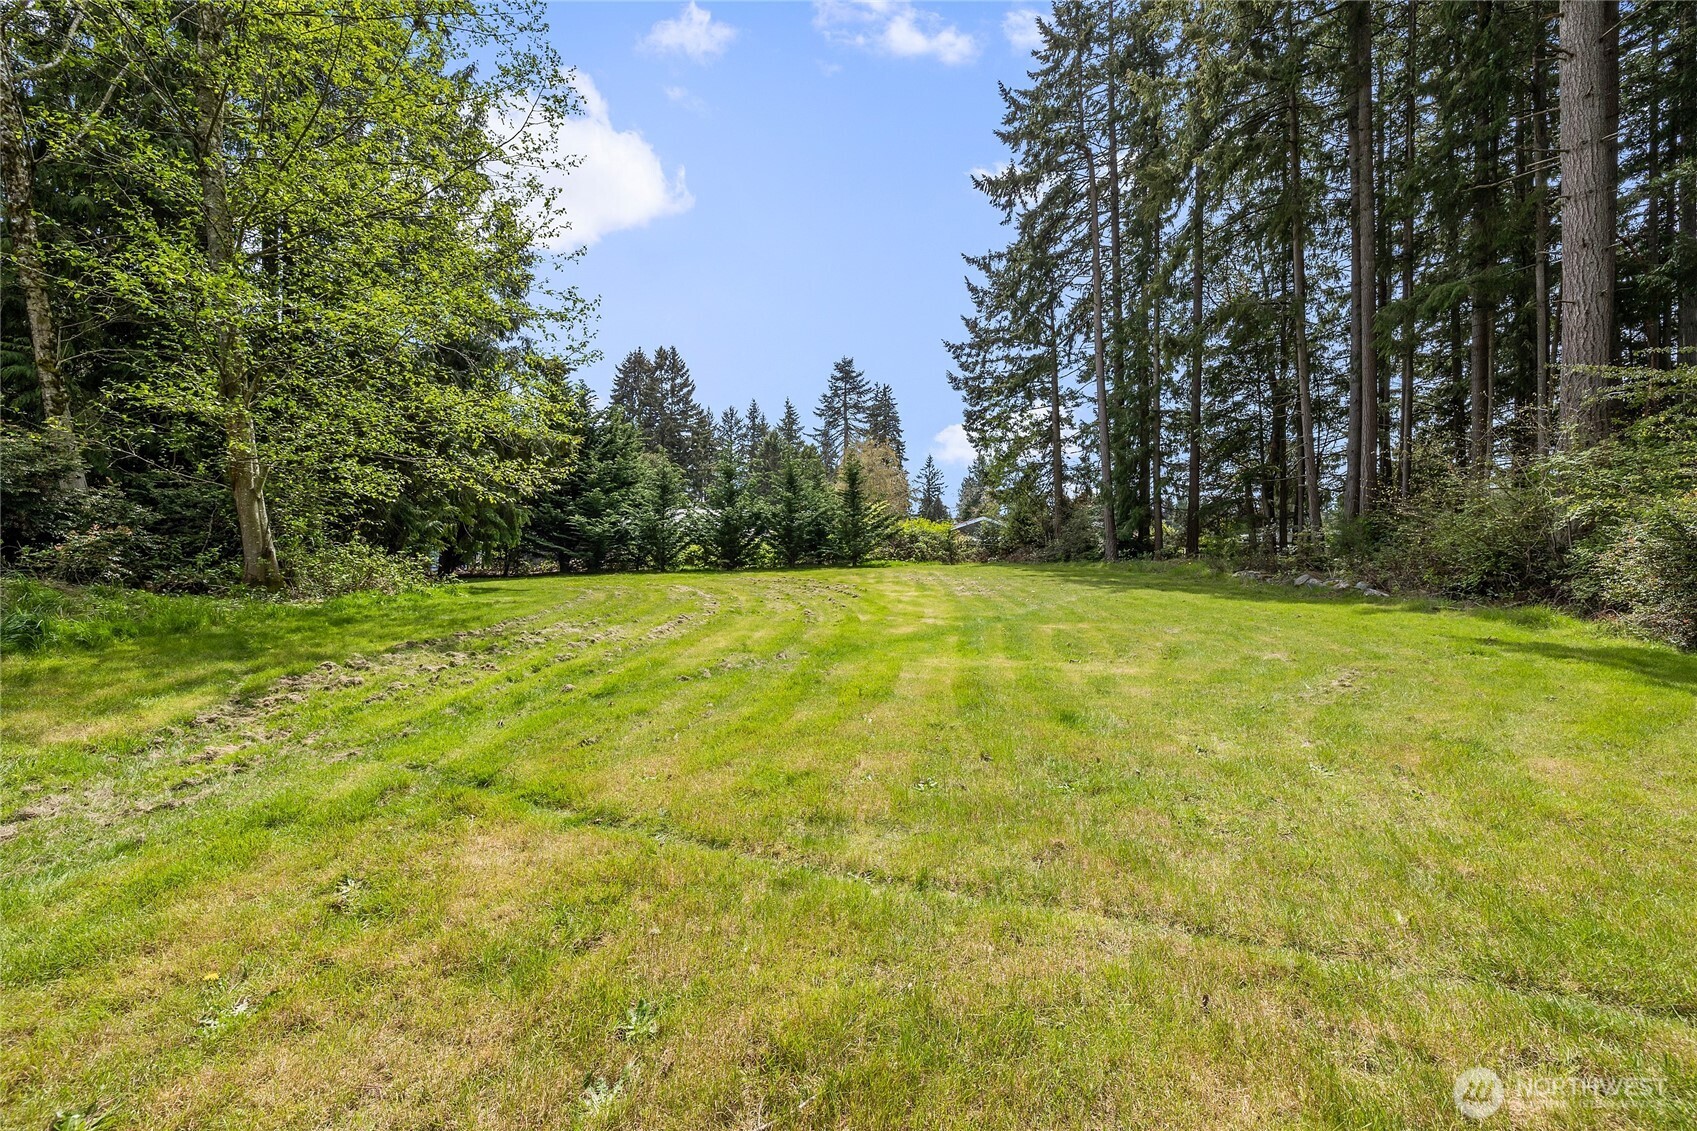
1922 Pottery Avenue, Port Orchard, WA 98366
Provided by NWMLS, Keller Williams Greater 360
Provided by NWMLS, Keller Williams Greater 360
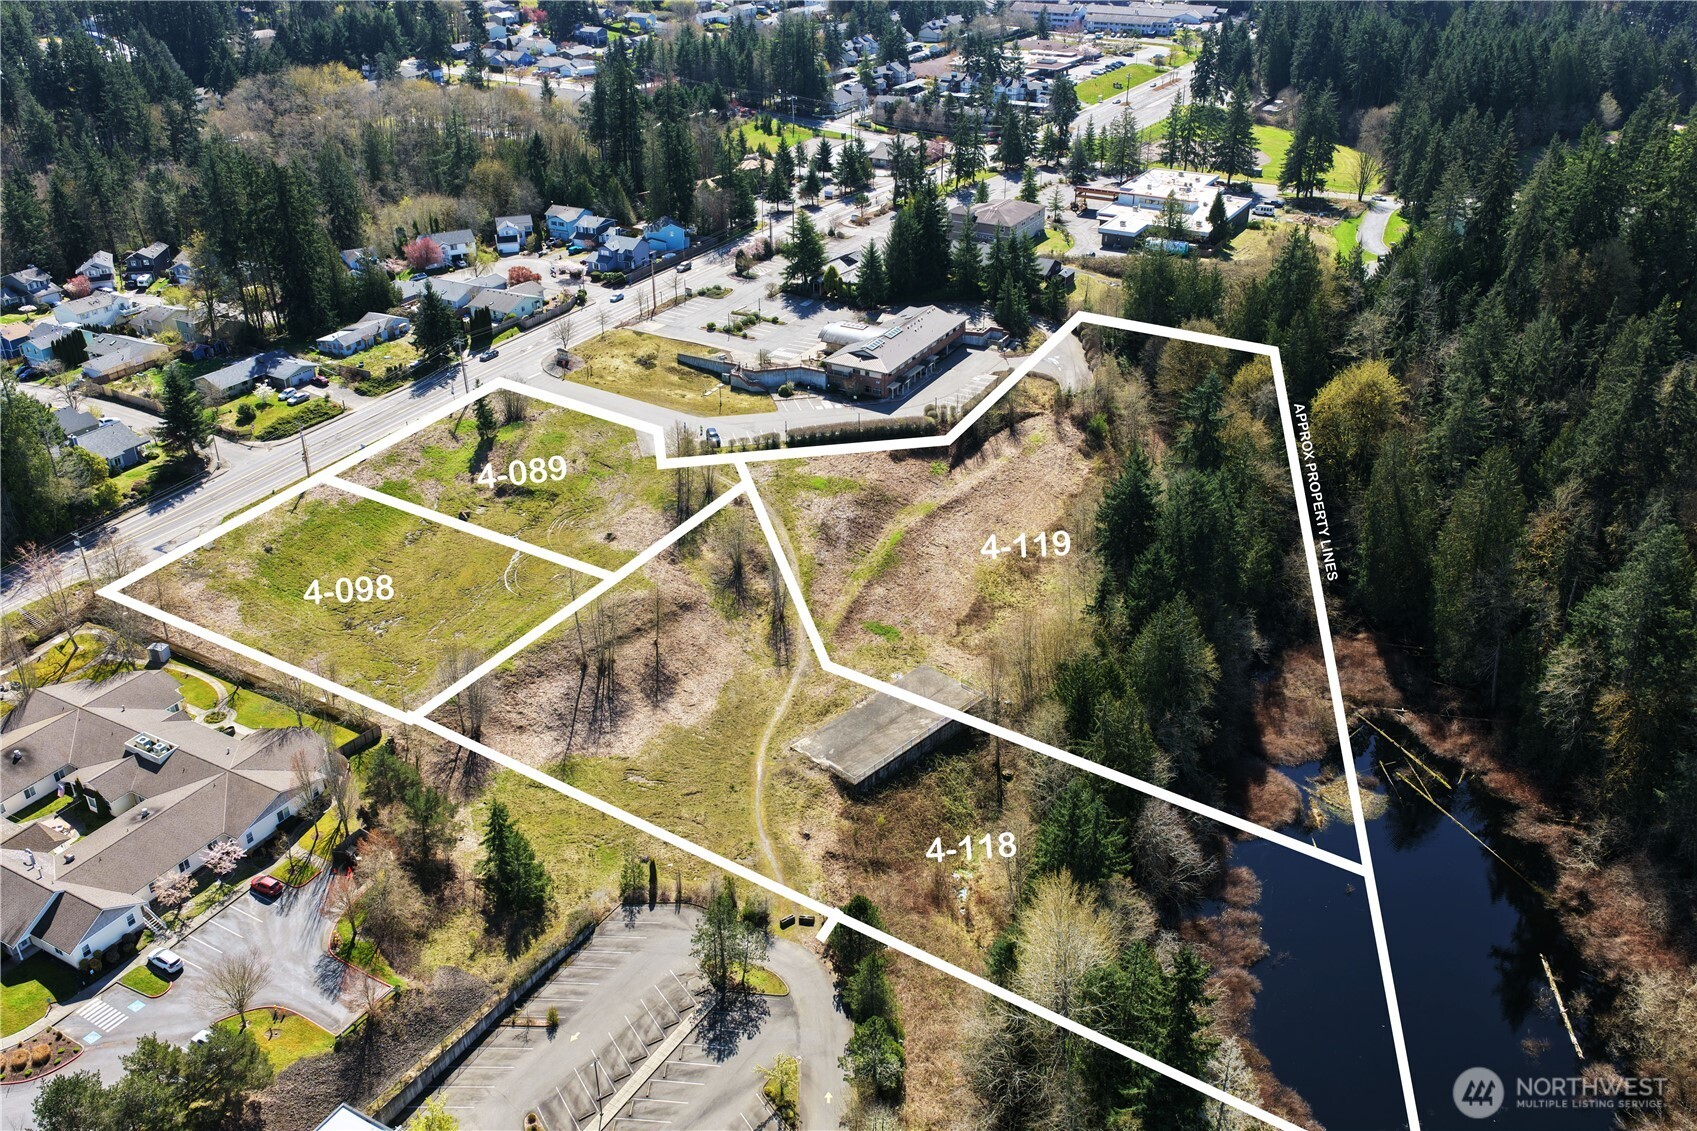
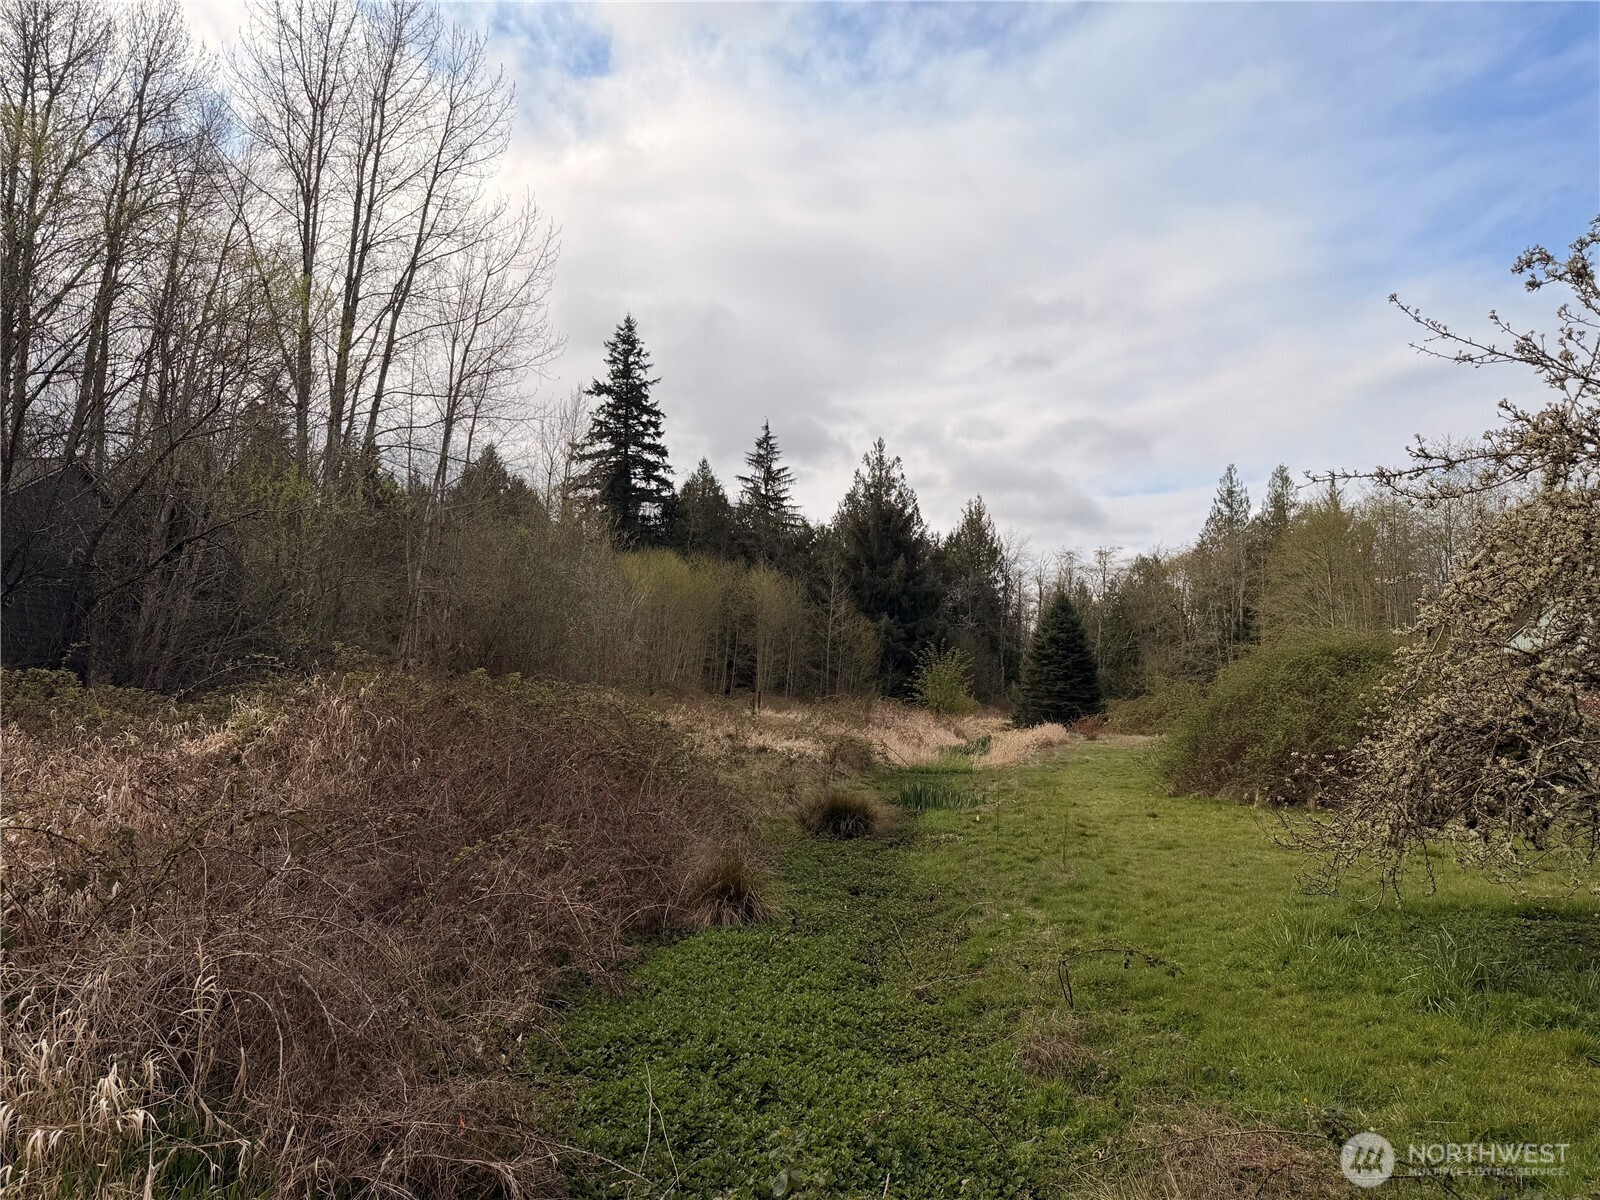
0 Pottery Avenue, Port Orchard, WA 98366
Provided by NWMLS, G Anderson Group LLC
Provided by NWMLS, G Anderson Group LLC
1932 SE Salmonberry Road, Port Orchard, WA 98366
Provided by NWMLS, G Anderson Group LLC
Provided by NWMLS, G Anderson Group LLC

22 Lots E Washington Street, Port Orchard, WA 98366
Provided by NWMLS, Disney Real Estate
Provided by NWMLS, Disney Real Estate
69,895 people live in Downtown, where the median age is 40.3 and the average individual income is $45,059. Data provided by the U.S. Census Bureau.
Total Population
Median Age
Population Density
Average individual Income
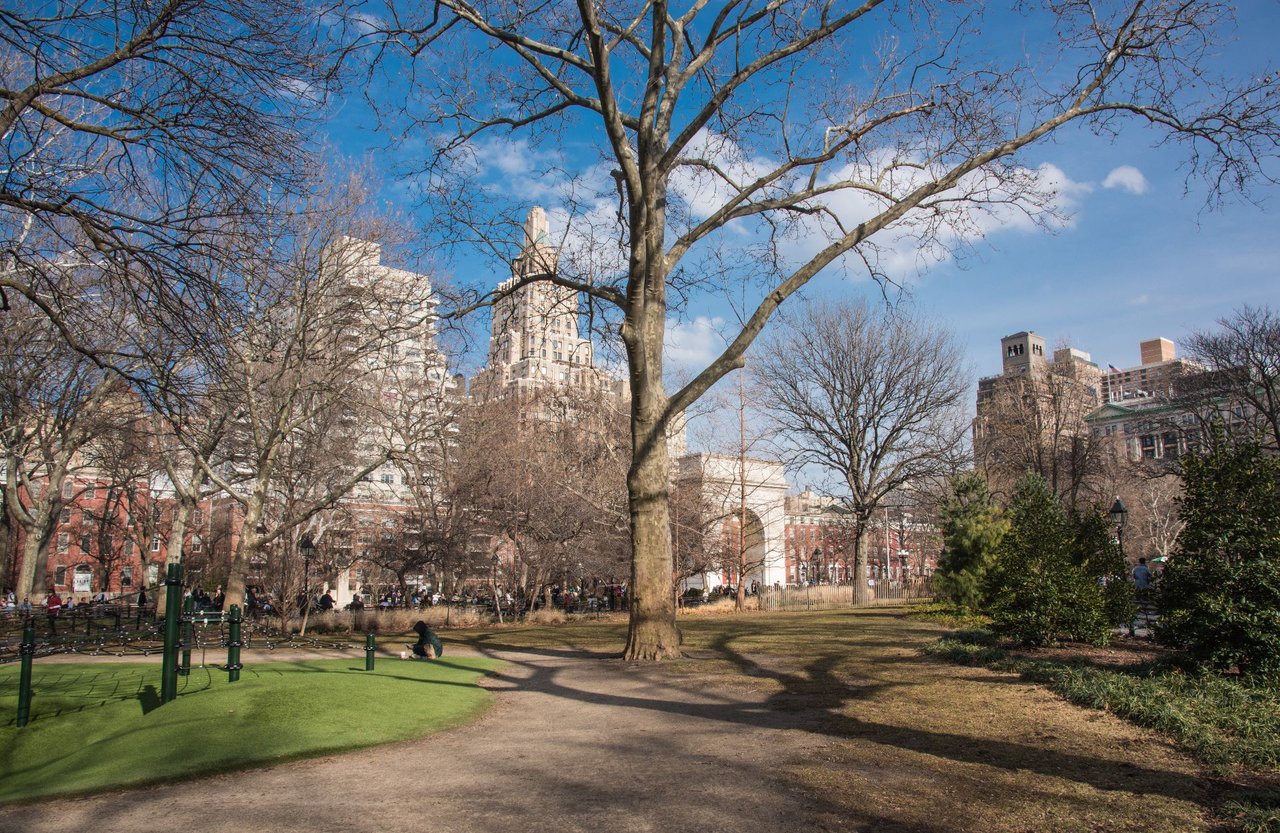
There's plenty to do around Downtown, including shopping, dining, nightlife, parks, and more. Data provided by Walk Score and Yelp.
Explore popular things to do in the area, including Dos Casas Thrift, Annapolis Fitness & Performance , and Lifestyles Massage.
| Name | Category | Distance | Reviews |
Ratings by
Yelp
|
|---|---|---|---|---|
| Shopping | 3.68 miles | 12 reviews | 5/5 stars | |
| Active | 3.99 miles | 14 reviews | 5/5 stars | |
| Beauty | 4.05 miles | 8 reviews | 5/5 stars | |
|
|
||||
|
|
||||
|
|
||||
|
|
||||
|
|
||||
|
|
Downtown has 26,758 households, with an average household size of 5.17. Data provided by the U.S. Census Bureau. Here’s what the people living in Downtown do for work — and how long it takes them to get there. Data provided by the U.S. Census Bureau. 69,895 people call Downtown home. The population density is 1,070 and the largest age group is Data provided by the U.S. Census Bureau.
Total Population
Population Density Population Density This is the number of people per square mile in a neighborhood.
Median Age
Men vs Women
Population by Age Group
0-9 Years
10-17 Years
18-24 Years
25-64 Years
65-74 Years
75+ Years
Education Level
Total Households
Average Household Size
Average individual Income
Households with Children
With Children:
Without Children:
Blue vs White Collar Workers
Blue Collar:
White Collar:

5356 OLYMPIC DR. SUITE B GIG HARBOR WA 98332
5356 OLYMPIC DR. SUITE B GIG HARBOR WA 98332