Welcome to
Bethel
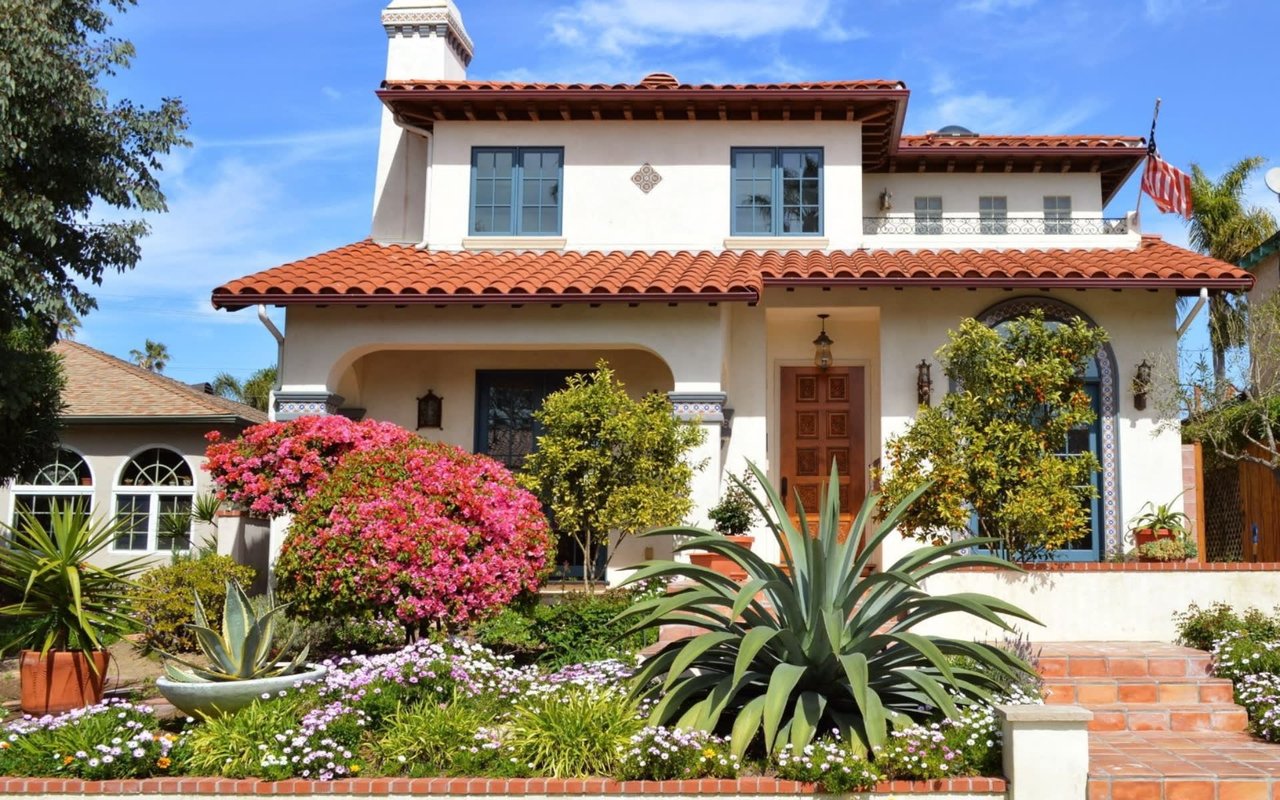
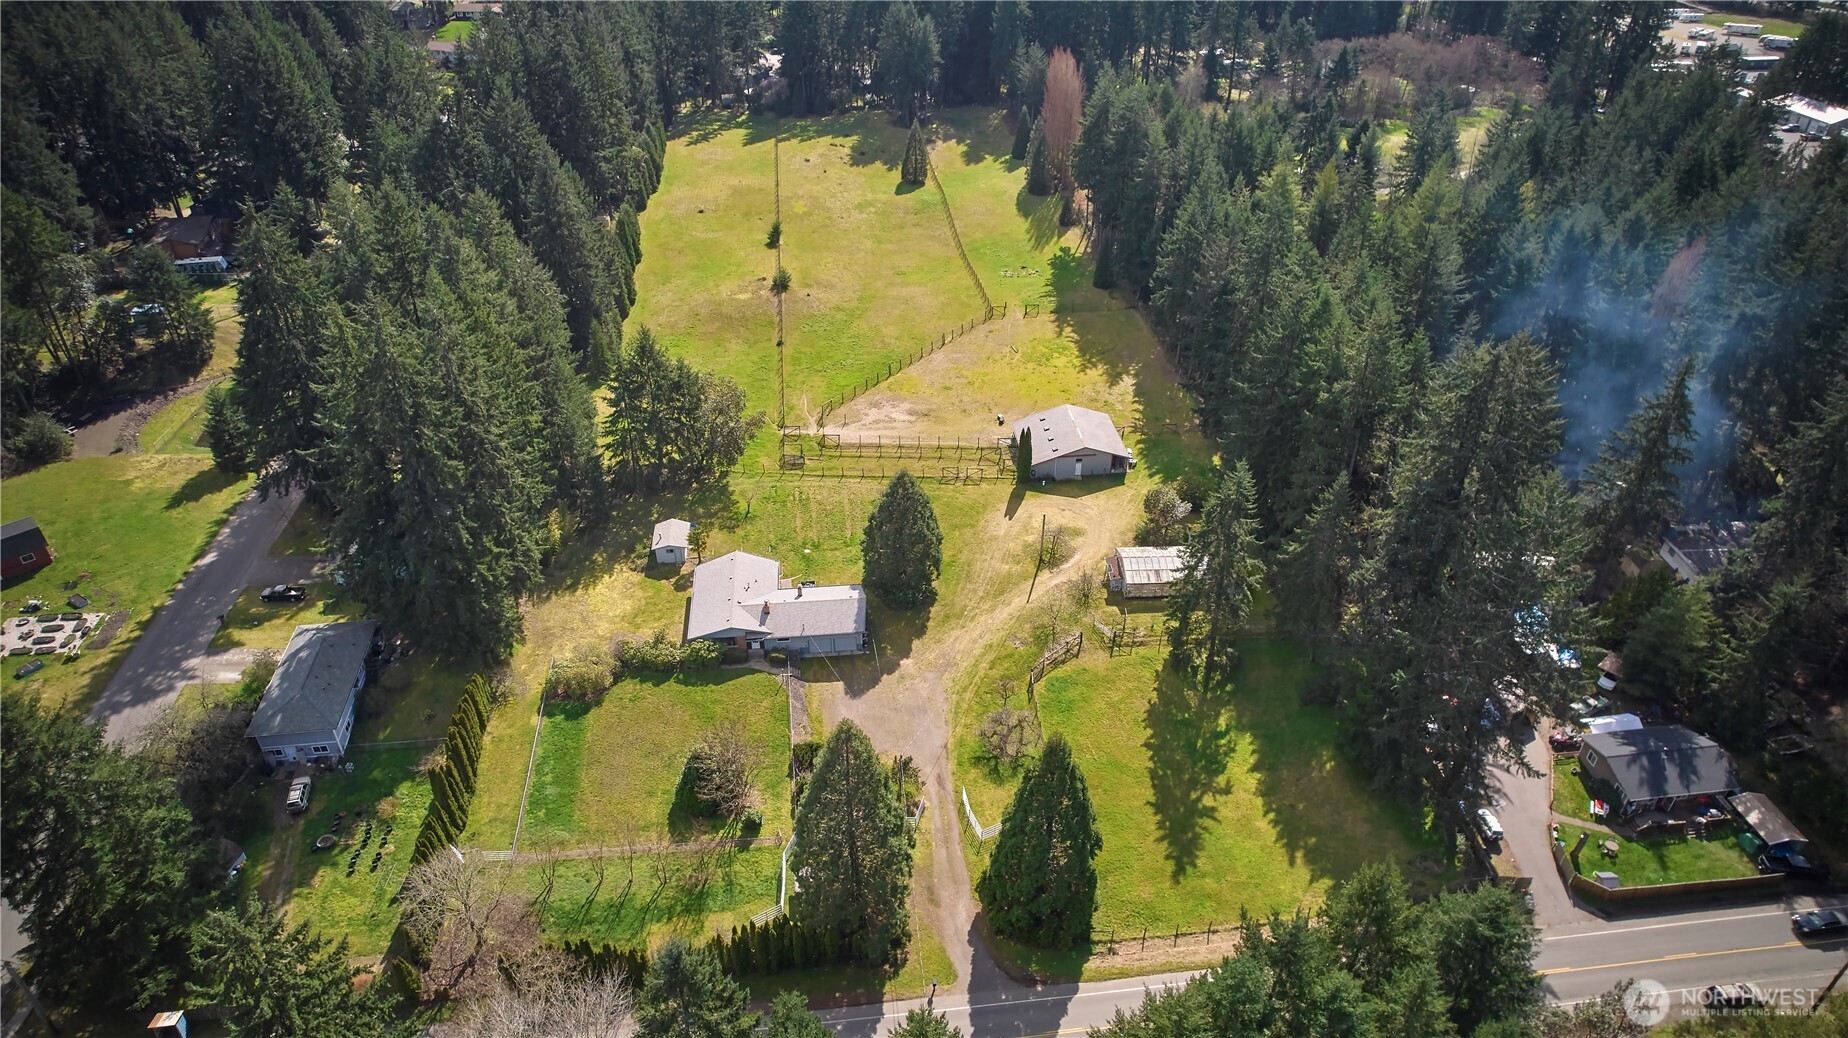
Bethel Port Orchard homes present clean streetscapes and practical amenities that make ownership easy.

5230 Bethel Road SE, Port Orchard, WA 98367
Provided by NWMLS, G Anderson Group LLC
Provided by NWMLS, G Anderson Group LLC
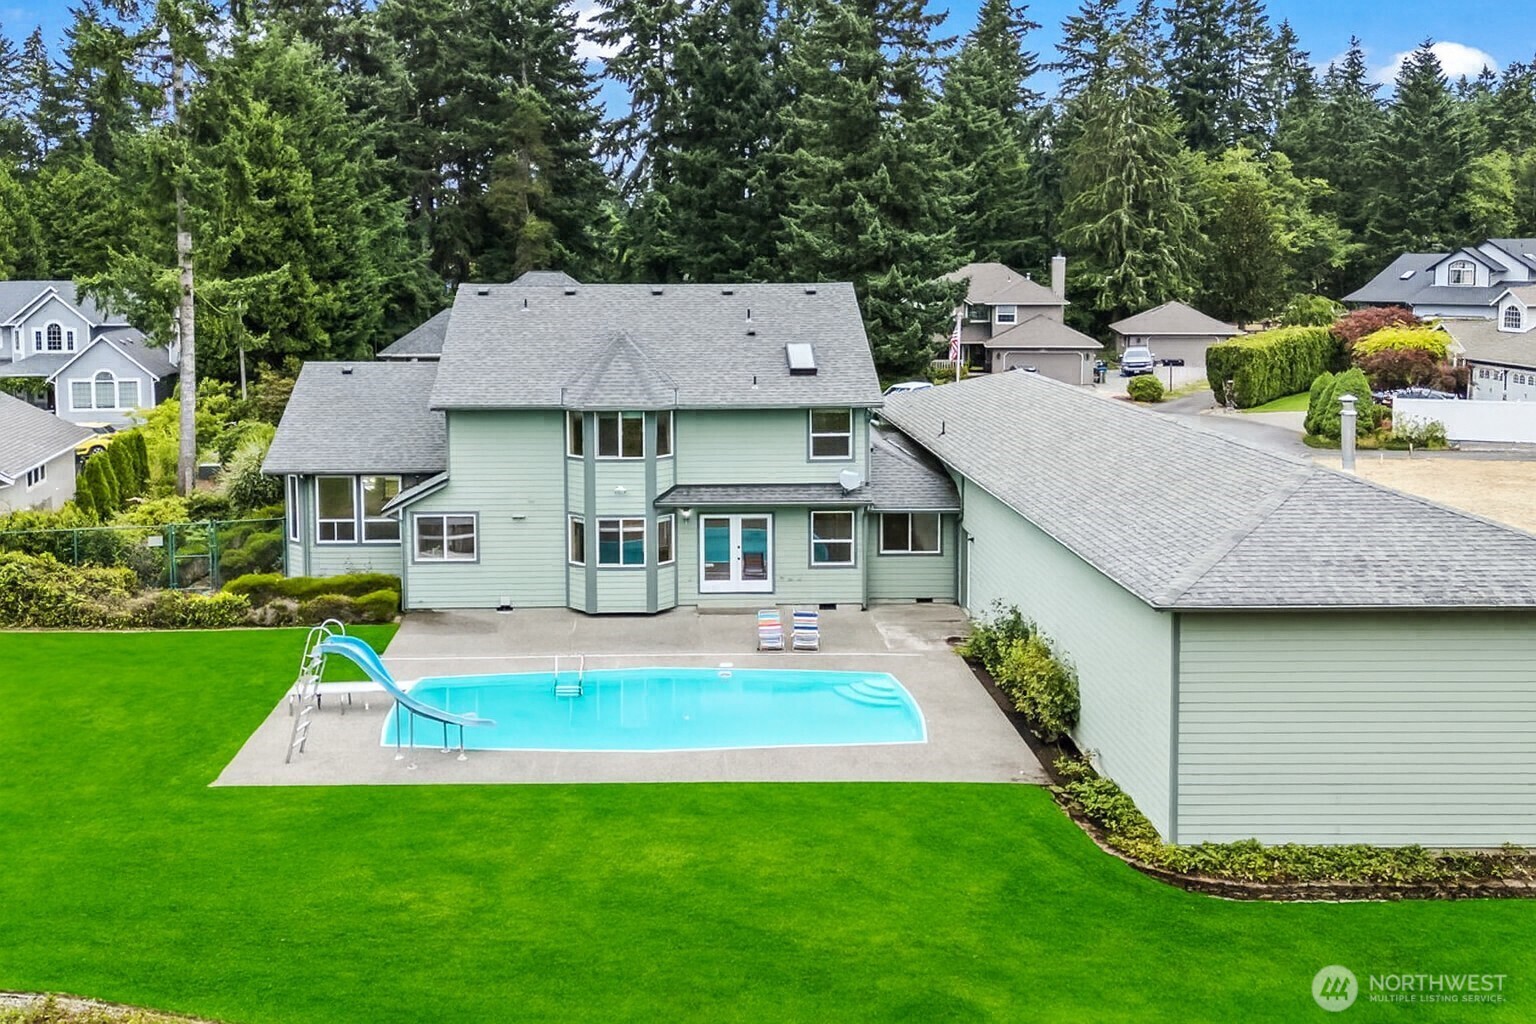
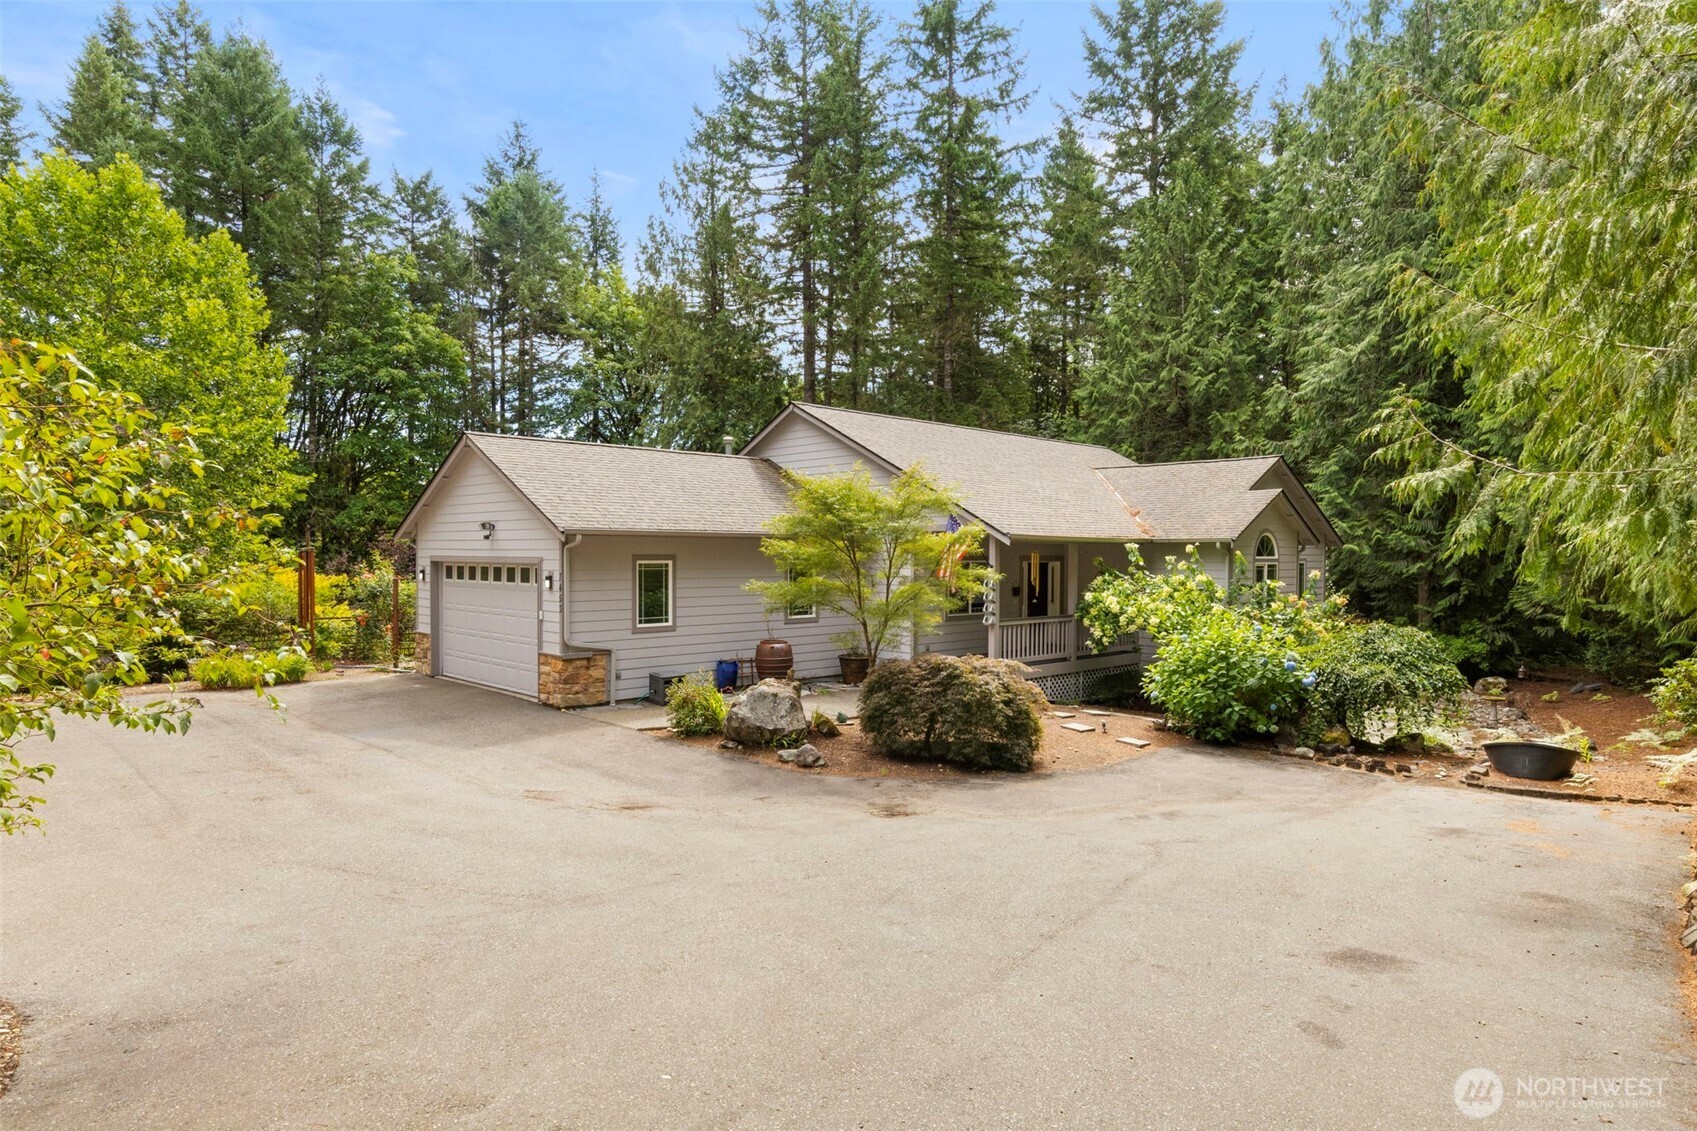
2426 SE Celebrity Court, Port Orchard, WA 98367
Provided by NWMLS, Hawkins Poe
Provided by NWMLS, Hawkins Poe
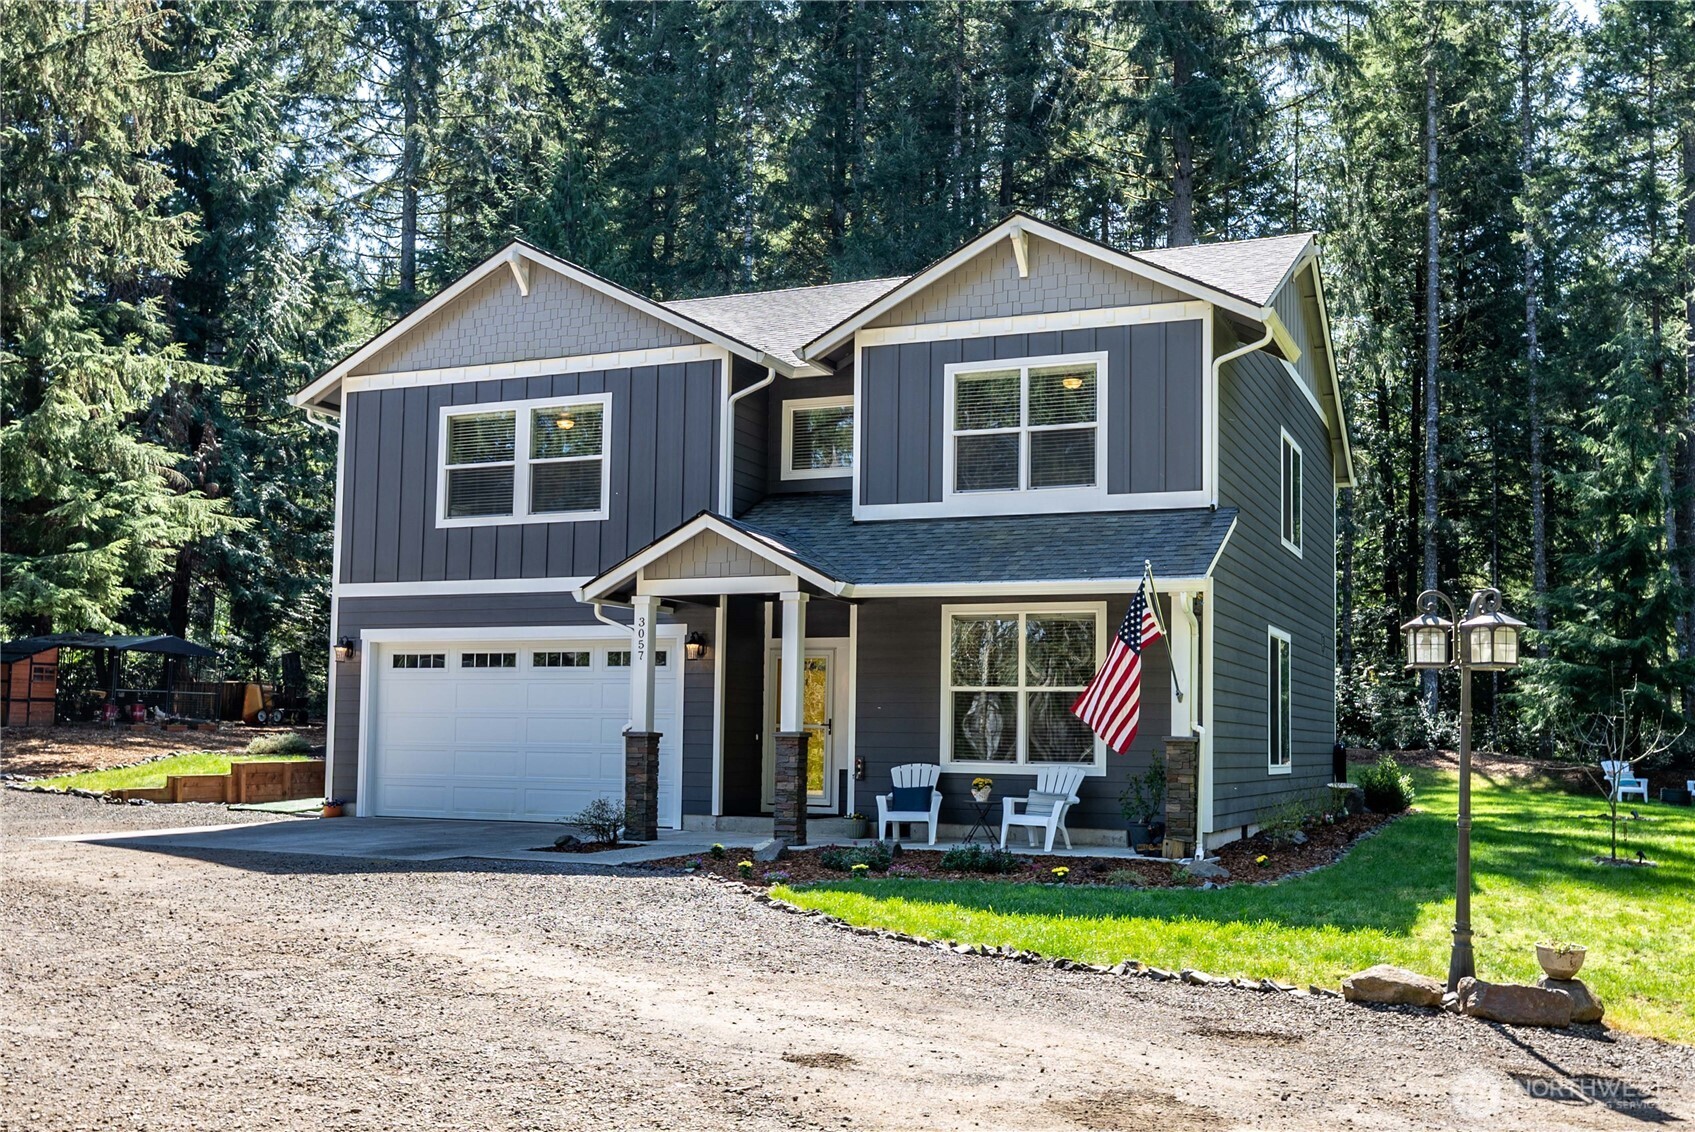
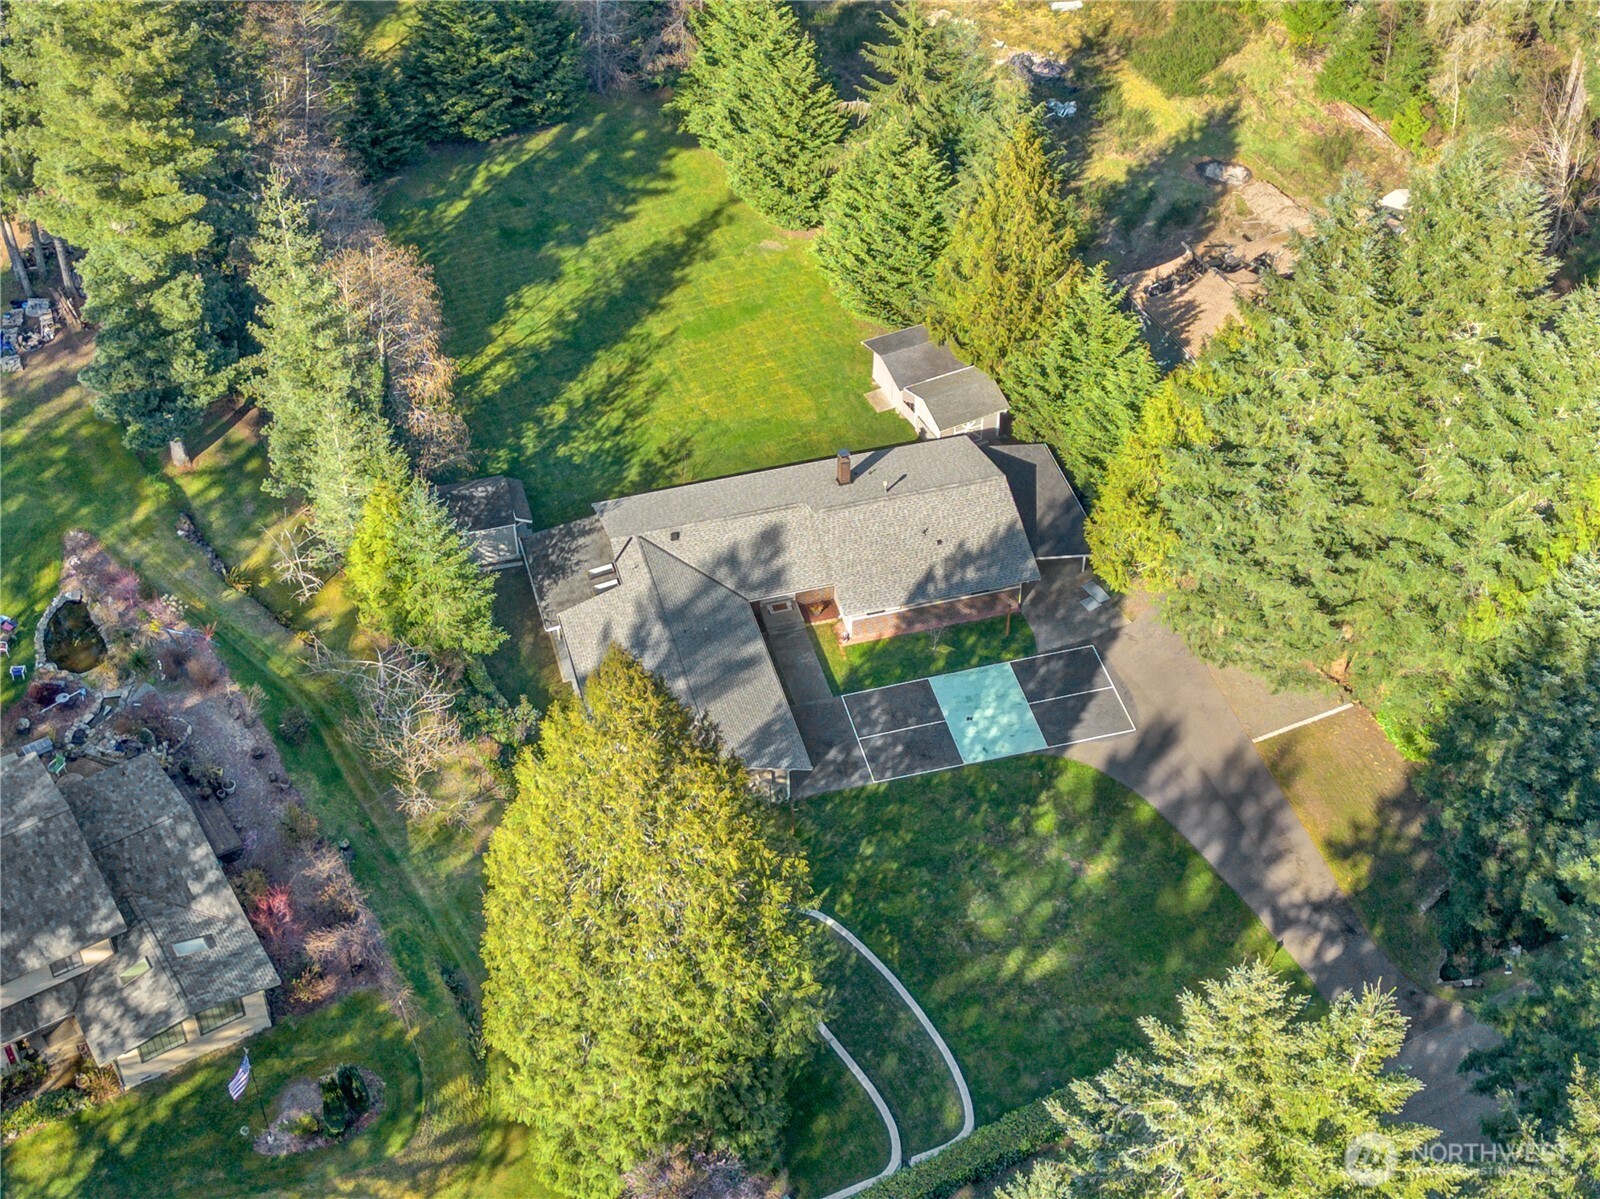
3057 SE Spring Creek Road, Port Orchard, WA 98367
Provided by NWMLS, COMPASS
Provided by NWMLS, COMPASS
1858 SE Cedar Road, Port Orchard, WA 98367
Provided by NWMLS, John L. Scott, Inc.
Provided by NWMLS, John L. Scott, Inc.
7453 Jason Lane SE, Port Orchard, WA 98367
Provided by NWMLS, Coldwell Banker Bain
Provided by NWMLS, Coldwell Banker Bain
2925 SE Royalwood Place, Port Orchard, WA 98367
Provided by NWMLS, Windermere Abode
Provided by NWMLS, Windermere Abode
4,276 people live in Bethel, where the median age is 42.4 and the average individual income is $40,929. Data provided by the U.S. Census Bureau.
Total Population
Median Age
Population Density
Average individual Income
There's plenty to do around Bethel, including shopping, dining, nightlife, parks, and more. Data provided by Walk Score and Yelp.
Explore popular things to do in the area, including Cup Of Jo, Annapolis Fitness & Performance , and Anchored Aesthetics.
| Name | Category | Distance | Reviews |
Ratings by
Yelp
|
|---|---|---|---|---|
| Dining | 3.09 miles | 13 reviews | 5/5 stars | |
| Active | 3.21 miles | 14 reviews | 5/5 stars | |
| Beauty | 2.75 miles | 5 reviews | 5/5 stars | |
| Beauty | 3.24 miles | 9 reviews | 5/5 stars | |
|
|
||||
|
|
||||
|
|
||||
|
|
||||
|
|
||||
|
|
Bethel has 1,628 households, with an average household size of 2.62. Data provided by the U.S. Census Bureau. Here’s what the people living in Bethel do for work — and how long it takes them to get there. Data provided by the U.S. Census Bureau. 4,276 people call Bethel home. The population density is 1,352.61 and the largest age group is Data provided by the U.S. Census Bureau.
Total Population
Population Density Population Density This is the number of people per square mile in a neighborhood.
Median Age
Men vs Women
Population by Age Group
0-9 Years
10-17 Years
18-24 Years
25-64 Years
65-74 Years
75+ Years
Education Level
Total Households
Average Household Size
Average individual Income
Households with Children
With Children:
Without Children:
Blue vs White Collar Workers
Blue Collar:
White Collar:

5356 OLYMPIC DR. SUITE B GIG HARBOR WA 98332
5356 OLYMPIC DR. SUITE B GIG HARBOR WA 98332